Hottest (and coolest) Housing Markets Around Joint Base Lewis-McChord.
At Blue Summit Homes, we love statistics so much that we thought it would be interesting to find out what cities around JBLM were selling homes the quickest and for the most money. The two statistics we calculated were sale price to list price ratio and months of inventory on the market. These are the results as of April 2016!
First up: Sale price to list price ratio
Often referred to as the sale to list ratio, this is a good indicator of how much sellers are willing to negotiate with buyers. As the number drops below 1.00, the buyer is negotiating more and more off of the list price. At 1.00, the buyer is paying exactly what the property is listed at. And as the number rises over 1.00, the buyer is paying over asking price... usually seen in a bidding war. Supply and Demand are the two main reasons this number fluctuates. As demand for homes rises, or the supply of available homes falls, the sale to list ratio generally increases.
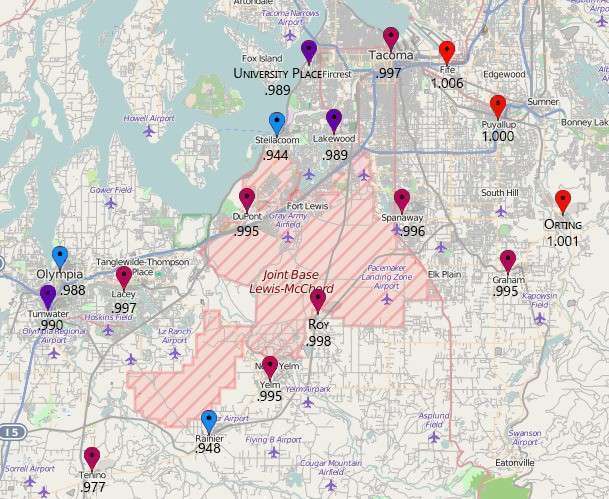
Ranked in order of hottest real estate market to coolest market based on sale to list ratio:
Fife – 1.006 sale price to list price ratio
Orting – 1.001 sale price to list price ratio
Puyallup – 1.000 sale price to list price ratio
Roy - .998 sale price to list price ratio
Lacey - .997 sale price to list price ratio
Tacoma - .997 sale price to list price ratio
Tenino - .997 sale price to list price ratio
Spanaway - .996 sale price to list price ratio
Dupont - .995 sale price to list price ratio
Yelm - .995 sale price to list price ratio
Graham - .995 sale price to list price ratio
Tumwater - .990 sale price to list price ratio
Lakewood - .989 sale price to list price ratio
University Place - .989 sale price to list price ratio
Olympia - .988 sale price to list price ratio
Rainier - .948 sale price to list price ratio
Steilacoom - .944 sale price to list price ratio
Next up: Months of inventory
The months of inventory method shows how many months it would take each city to sell all the homes currently available for sale, given no other homes were listed. The lower the number, the fewer homes available for buyers. This makes a seller’s market. A higher number usually coincides with a buyer’s market, as there is more inventory to choose from. Again, this comes back to a supply and demand issue. When demand increases or supply decreases, the months of inventory number will fall.
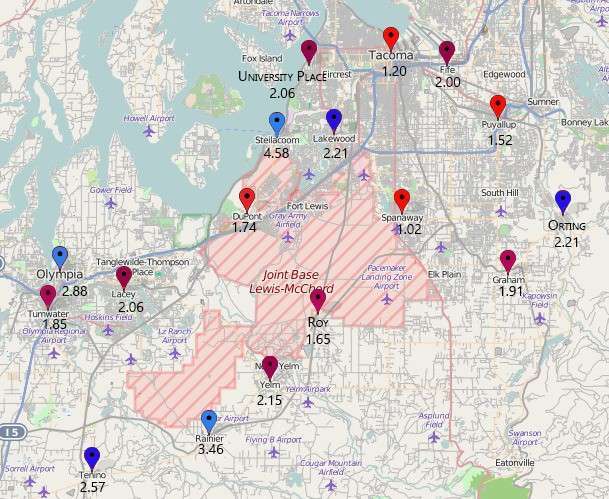
Ranked from hottest real estate market to coolest market based on months of inventory:
Spanaway – 1.02 months of inventory
Tacoma – 1.20 months of inventory
Puyallup – 1.52 months of inventory
Roy – 1.65 months of inventory
Dupont – 1.74 months of inventory
Tumwater – 1.85 months of inventory
Graham – 1.91 months of inventory
Fife – 2.00 months of inventory
Lacey – 2.06 months of inventory
University Place – 2.06 months of inventory
Yelm – 2.15 months of inventory
Orting – 2.21 months of inventory
Lakewood – 2.21 months of inventory
Tenino – 2.57 months of inventory
Olympia – 2.88 months of inventory
Rainier – 3.46 months of inventory
Steilacoom – 4.58 months of inventory
The underlying theme is that homes in Pierce County (North of JBLM) tend to sell closer to the asking price (based on the sale to list ratio) and quicker (based on the months of inventory) than homes in Thurston County (South of JBLM). Does this mean one should only be looking for a home to purchase in these areas? Probably not. There are many other factors to look at when deciding where to purchase a home. For example, if you are looking for a more rural setting, an area like Yelm or Roy would be more suitable than Tacoma or Lacey. What we should be taking away from the information above is that not all markets around JBLM are the same. Some will allow the buyer to negotiate stronger on the purchase price, while in other markets, the buyer may need to act quicker and with a stronger offer to get the home they want.
Make sure to check out our JBLM real estate page. All of the statistics we discussed here plus more are updated daily along with 1000's of homes available for sale.
